Lower Fairfield County’s Flood Problem Isn’t a Mystery—It’s a To-Do List
More than four inches of rain fell in parts of lower Fairfield County on Tuesday, July 21 and many of the hardest hit places are ones that frequently flood. See what communities are trying to do to address these areas.
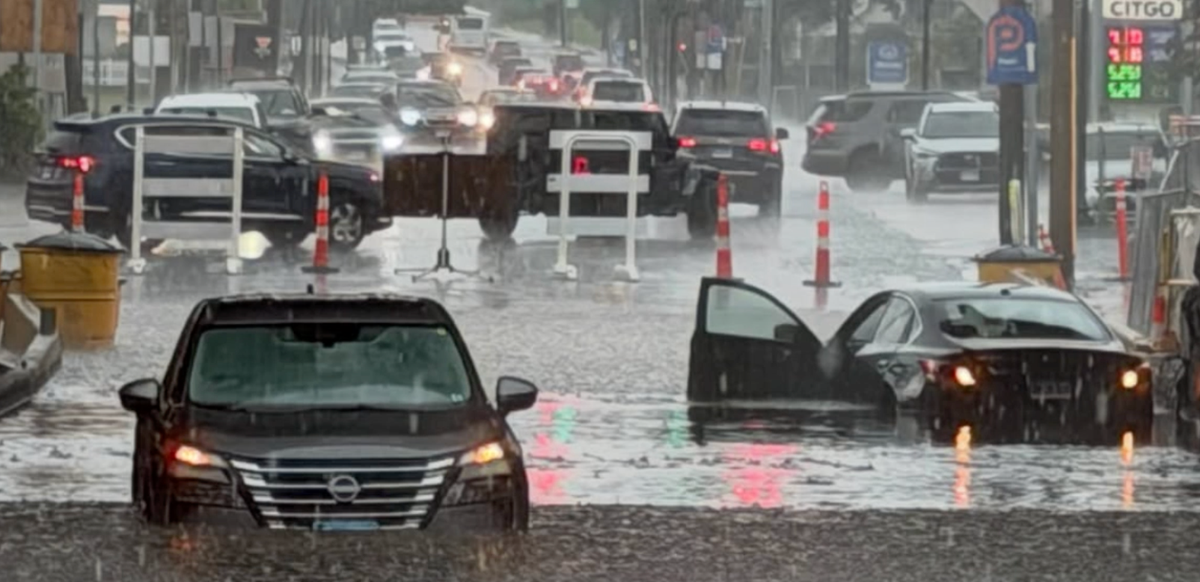
It was mid-afternoon over lower Fairfield County on Tuesday, July 21 when the skies opened up and rain came pouring down. Some parts of the region experienced more than four inches of rain in just a few hours. The downpour overwhelmed local roads, left drivers stranded, and prompted multiple rescues from local law enforcement.
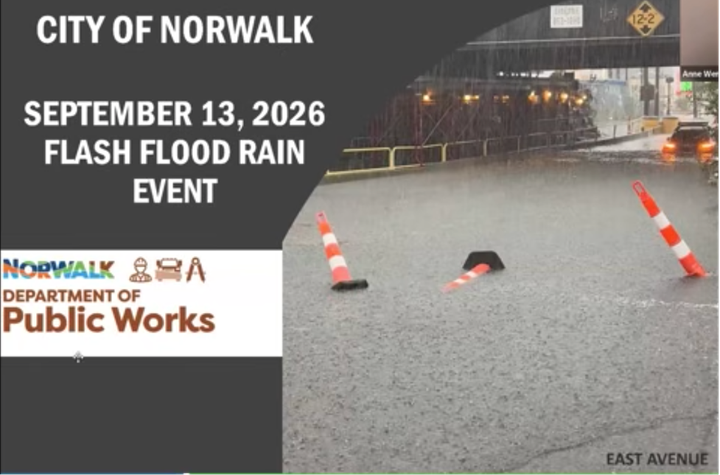
And some of the worst conditions took place in areas known for flooding—parts of South Norwalk (particularly Water Street and Meadow Street), Fairfield along the Rooster River, and many spots across the region that have low-lying roads underneath railroad bridges.
Let’s explore what happened on July 21 and what can be done to help improve conditions in these areas.
Inside the Storm on July 21
While the day was filled with on and off thunderstorms, the storm that rolled through just as the evening commute was starting a little after 4 p.m. inundated the region, prompting severe thunderstorm and flash flood warnings from the National Weather Service.
Parts of Norwalk and Stamford recorded more than four inches of rain, while parts of Darien and Fairfield saw more than 3.5, according to the Community Collaborative Rain, Hail, and Snow Network, a nonprofit organization that uses volunteers to measure and map precipitation.
Officials issued urgent warnings asking drivers to stay off flooded roads.
“Just a few inches of water can cause you to lose control of your vehicle, and deeper water can quickly sweep a vehicle away or hide dangerous road hazards,” Norwalk Police wrote in a statement.
Greenwich even saw a “mini tornado” touch down in the Glenville section of town, but First Selectman Fred Camillo said that thankfully the town “came out of it pretty unscathed.”
Prone to Flooding
Some of the areas that experienced the worst flooding are those that are well-known to local officials. In fact many communities are either planning to or are actively investing in infrastructure improvements in these areas.
Norwalk and Fairfield partnered with UCONN’s Connecticut Institute for Resilience and Climate Adaptation (CIRCA) to develop resilient plans for some of their most flood prone sections. Stamford is actively finalizing a coastal resilience plan to help “identify and better understand coastal flood vulnerabilities and establish adaptation strategies” to help the city be “more resilient in the future.”
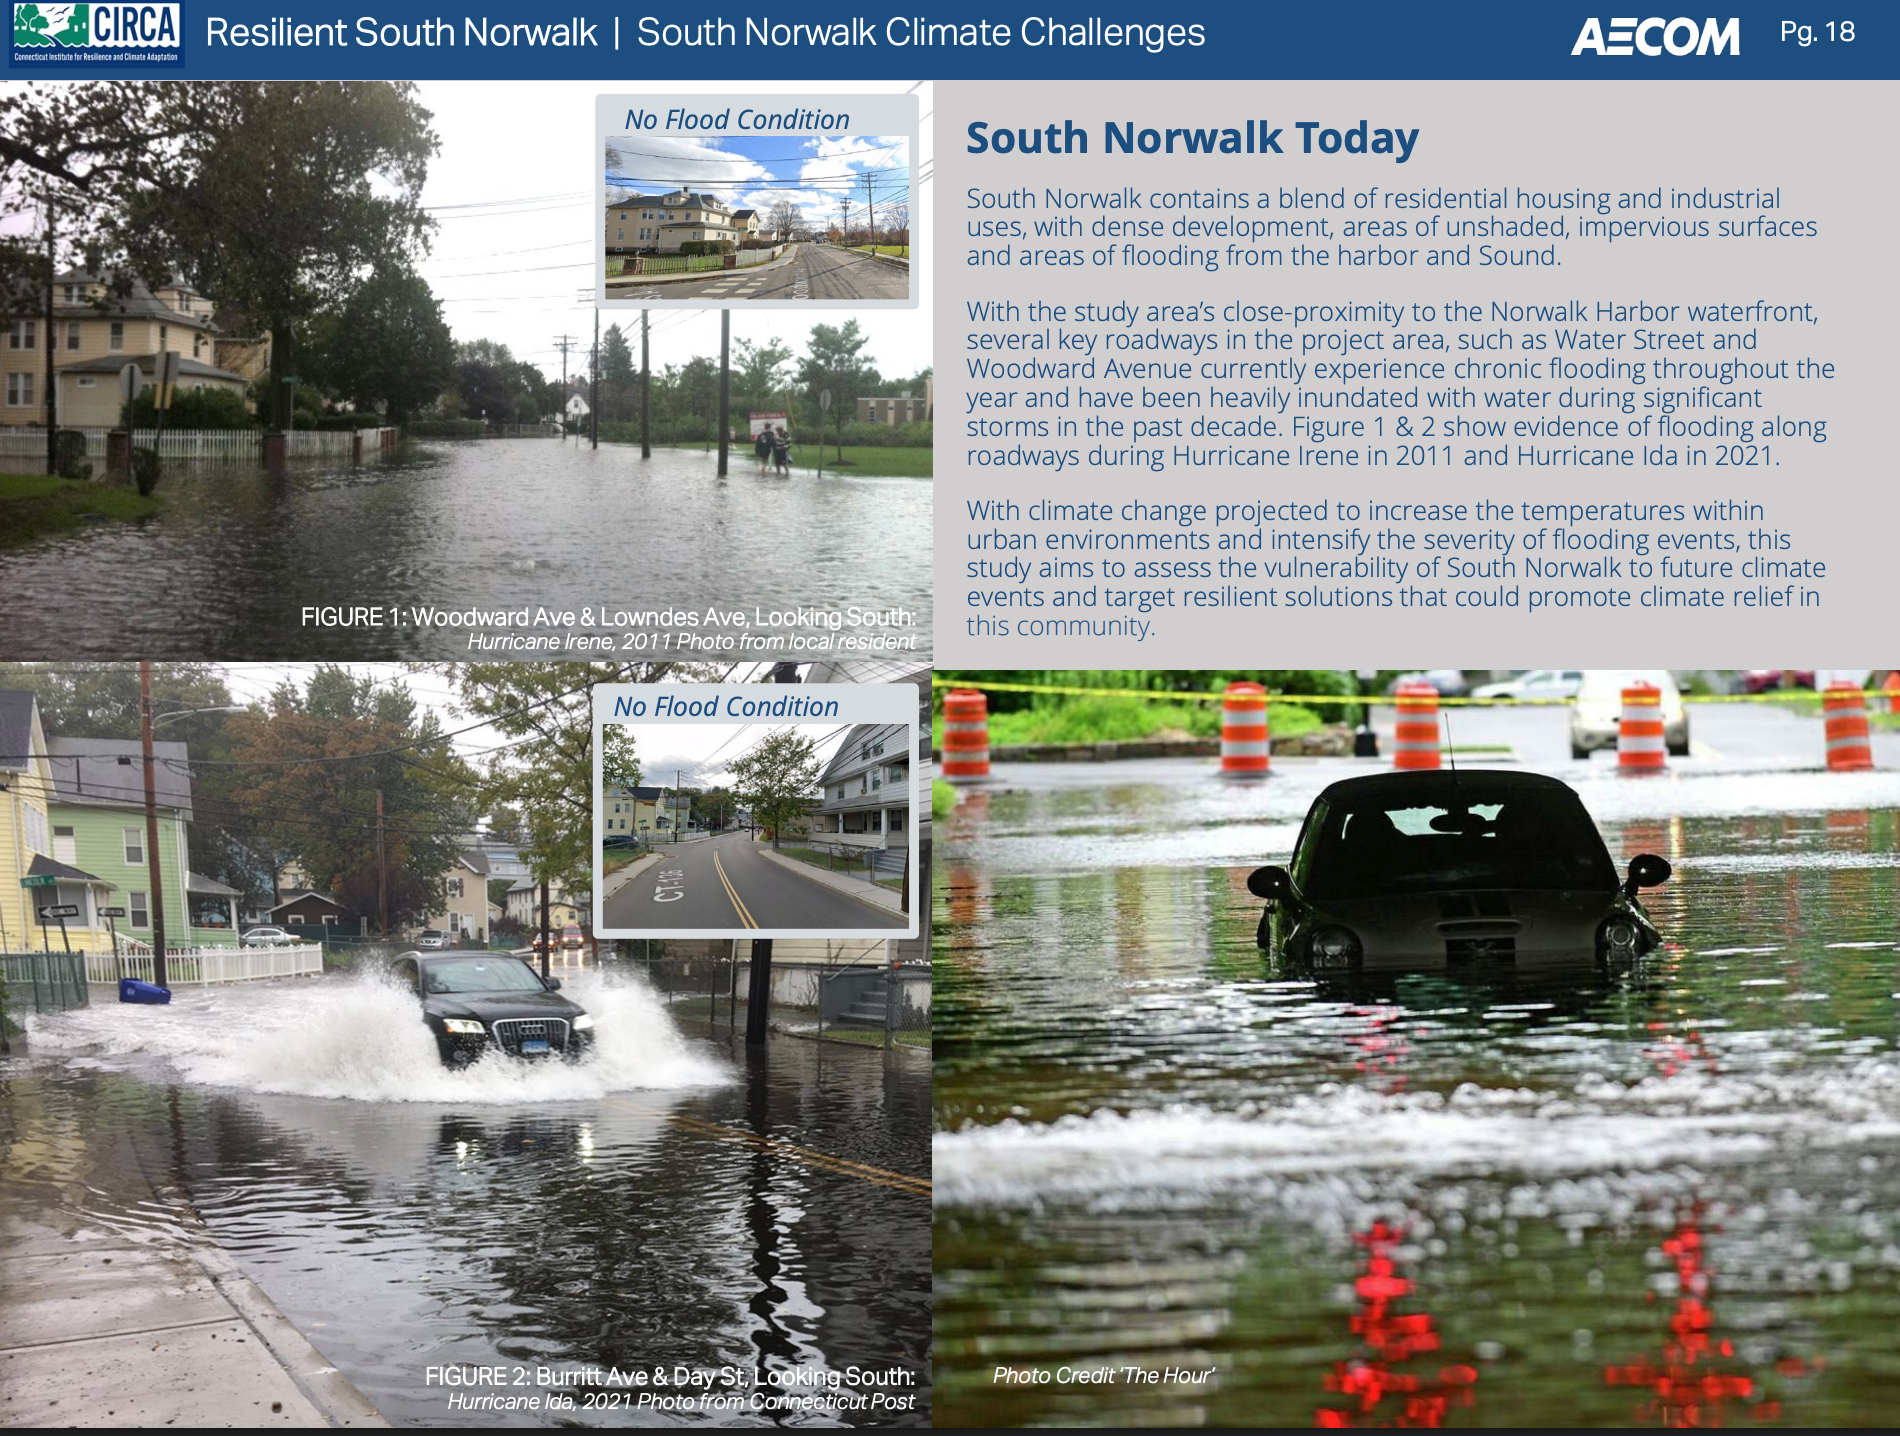
“With the study area’s close-proximity to the Norwalk Harbor waterfront, several key roadways in the project area, such as Water Street and Woodward Avenue currently experience chronic flooding throughout the year and have been heavily inundated with water during significant storms in the past decade,” Resilient South Norwalk found.
Many of these plans noted the challenges low-lying areas face during storms that dump inches of rain in a short period of time.
“Currently, South Norwalk is experiencing flooding along the roadways within the project area,” the Resilient South Norwalk plan noted. “During major storm events, the project area can see about four to five feet of storm surge flooding and a more frequent 10-year storm event will experience about two to three feet of flooding.”
The draft Stamford Coastal Resilience Plan found “Stamford’s South End and Cummings Park range in elevation from 1-9 feet, [making] many areas susceptible to flooding. These low-lying areas are at risk of flooding today, even without the additional influence of sea level rise.”
The Resilient Fairfield Plan noted that “as a coastal community Fairfield experiences higher levels of flood vulnerability due to its proximity to Long Island Sound and low elevation. The flood vulnerability index indicates that flood vulnerability is generally highest south of the railroad and along Southport Harbor, Pine Creek and Ash Creek.”
In particular, the plan focused on four underpasses—Mill Plain Road, North Pine Creek Road, Round Hill Road, and North Benson Road—as they are “important means of transportation in the town and serve as the evacuation routes from areas of flood risk.”
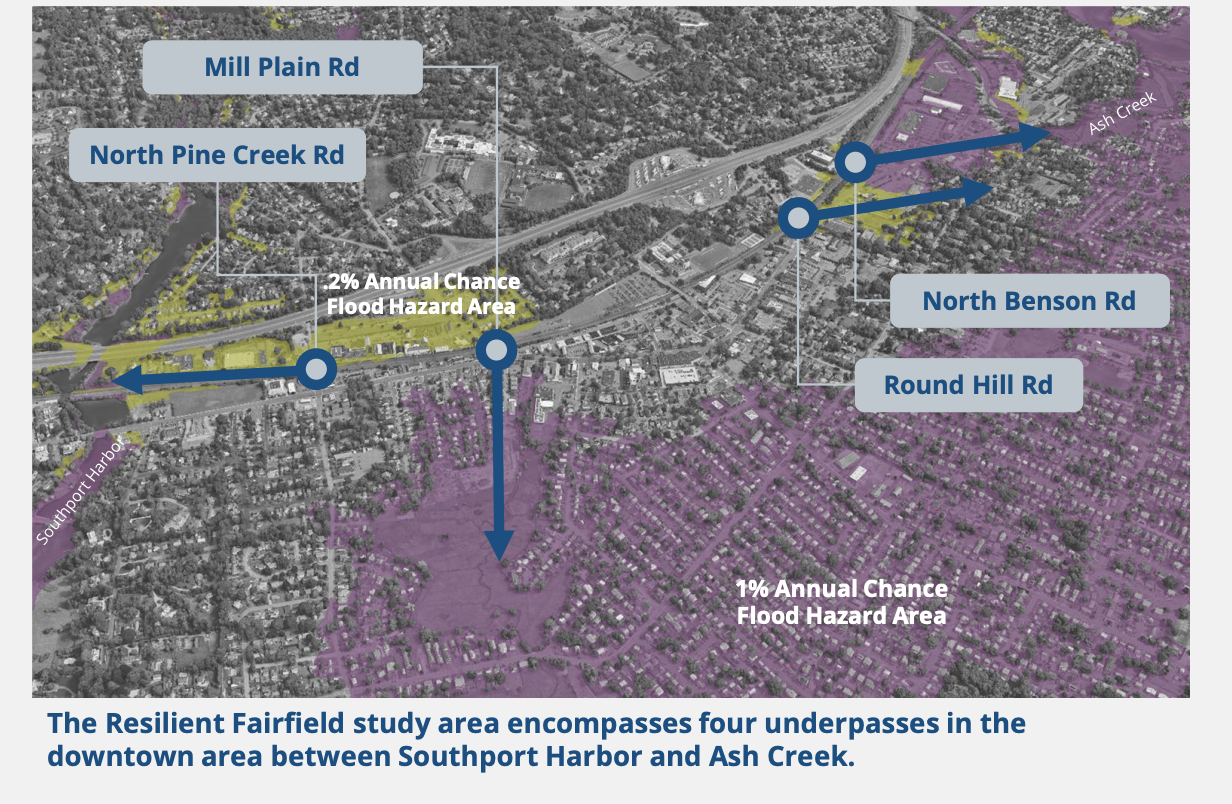
“The flooding at these critical points is due to a combination of factors. Inland overflow from tidal waters and storm surge, extreme rainfall intensity and frequency, and existing stormwater infrastructure issues all contribute to the frequent flooding of downtown Fairfield,” the report found.
So What Can Be Done?
As noted many of these areas that flooded on July 21 are areas of common flooding. That’s why many of these plans call for implementing infrastructure solutions to help alleviate some of the flood-related challenges, particularly as storms could get worse due to climate change. However, almost all of the solutions require millions in investments which is why many are just in the planning stage.
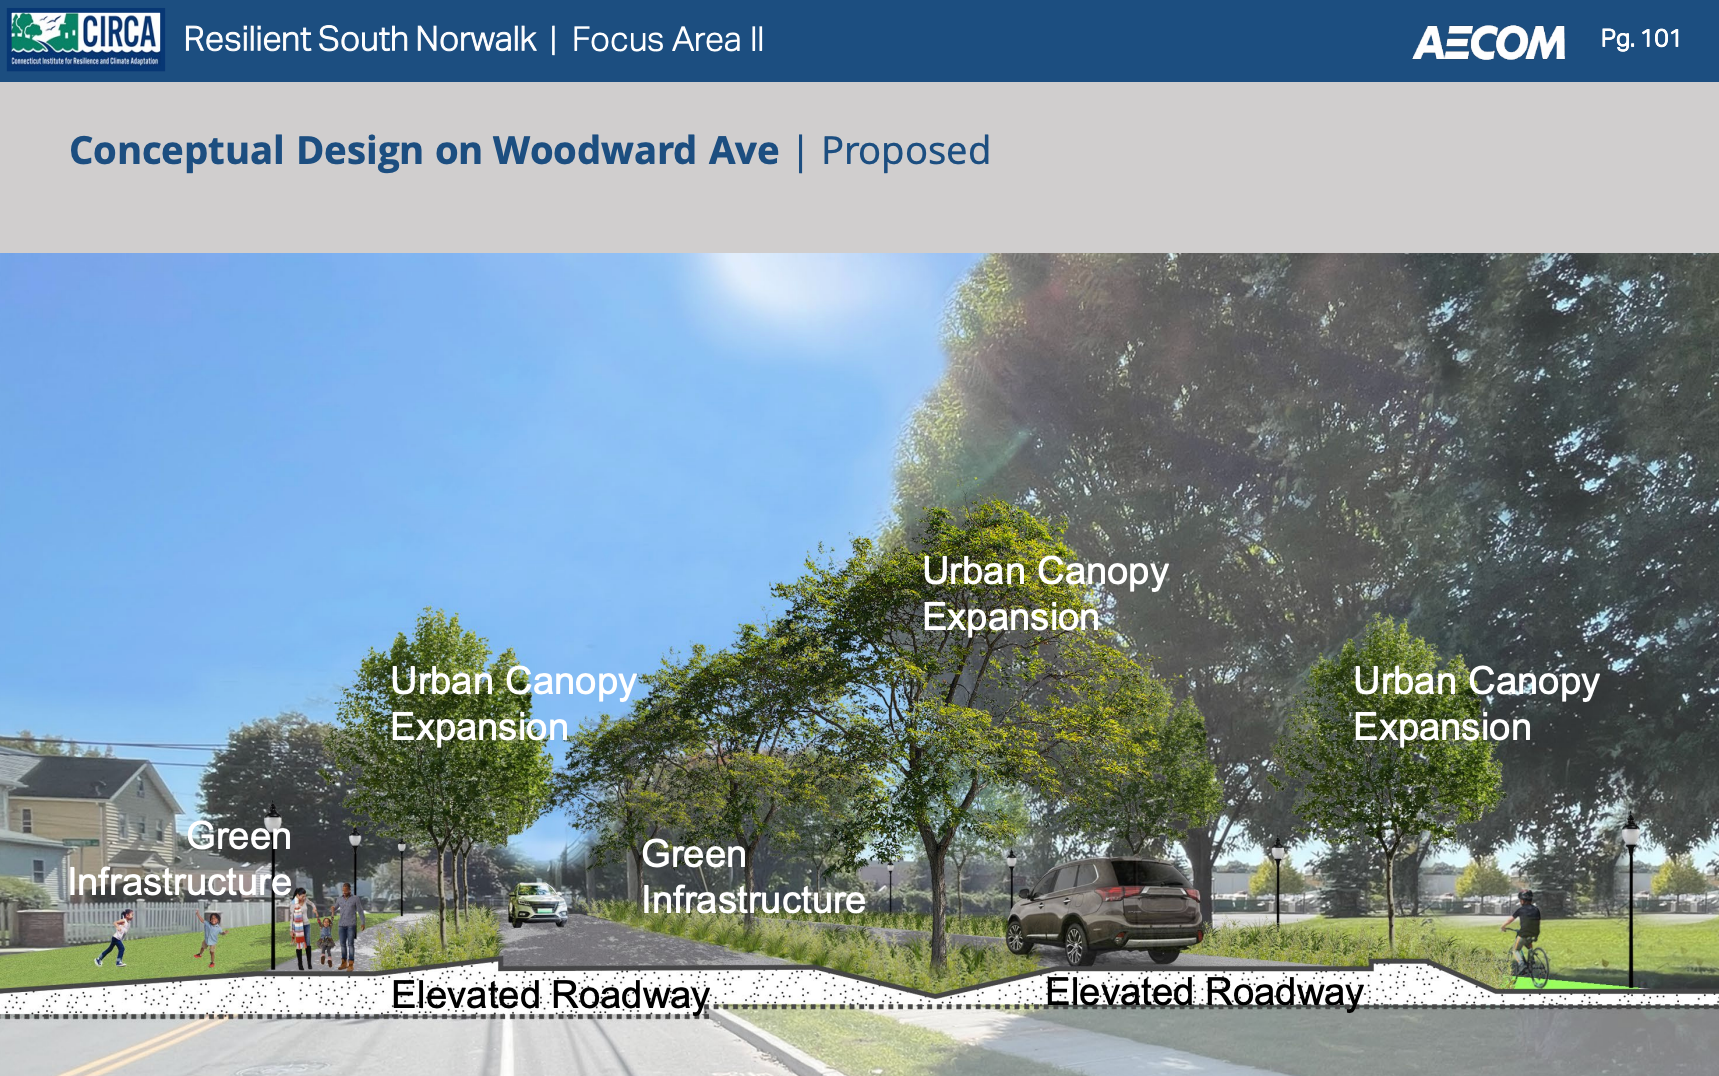
The Resilient South Norwalk plan called creating “resilient corridors,” which would focus on some of the main roadways, like Woodward Avenue, and raise them to make sure there would be safe “access and egress for residents, emergency vehicles, and critical services during storm events under current and future flood conditions.”
“The elevation of Woodward Ave. creates opportunity for access during flooding,” the plan found. “Woodward Ave. also provides an opportunity to incorporate both planted buffers along the sidewalk and bike path as well as a planted median wide enough to accommodate tree plantings.”
Woodward Avenue was particularly called out by residents this week as it’s the main road to get to Manresa Island, home to a decommissioned power plant that could be transformed into a public park. Some residents had raised concerns about the size of the proposed Manresa Wilds project, given that’s the only way to get on and off the site by car.
Resilient South Norwalk noted that three areas of Woodward Avenue in particular—the intersection with Lawrence Street, the intersection with Neptune, and near Village Creek Park—”experience frequent flooding.”
Stamford’s proposed resilience plan called for adding a flood sensor network to better track rising waters and to alert officials when flooding was occurring, in addition to investing in green stormwater infrastructure and stormwater pumps.
Meanwhile in Fairfield, one of the areas that saw the most flooding was near the Rooster River. This area of town has been a challenge for years, with severe flooding documented multiple times including in 2006, 2007, and 2018.
That prompted the town to start the Rooster River Mitigation Project, which aims to “reduce flooding potential within the Rooster River watershed” by constructing detention basins and other improvements that should “reduce the amount of flooding, reduce the frequency of flooding, reduce property damage, improve access, and improve water quality.” The town recently approved an additional $2.5 million for the project before bids for construction work at Fairchild Wheeler Golf Course and Tunxis Hill. The project had already received about $6 million from state and federal sources.
Still, officials warn that these types of intense rain storms could become more frequent and stress local infrastructure even more.
Resilient Fairfield analyzed data from the University of Oregon PRISM project and the Connecticut Physical Climate Assessment Report and found that precipitation days that included four inches of rain or more increased the most.
“Over the preceding decade the study area only recorded a single day with over 4 inches of rainfall, in that same decade with a ‘mid-century’ precipitation increase the study area would have received 6 days with over 4 inches of rainfall,” the plan found.