How’s the Water? A Look at the Water Quality of the Long Island Sound
A look at the 2022 Save the Sound Report on the water quality of the Long Island Sound.
The Long Island Sound is an essential part of Connecticut—businesses rely on it; people swim in it and use it for recreational activities; fish, plants, and shellfish call it home.
It’s an “economic engine,” according to Elena Colon, the laboratory manager at Save the Sound, “providing approximately 200,000 jobs and ecosystem services estimated at a value between $17 to $37 billion a year.”
That’s why paying attention to its water quality is so important. Save the Sound, a regional nonprofit focused on environmental action, released its 2022 Report Card, which includes grades for the open waters of the Long Island Sound, running from its western-most spots in New York, all the way to eastern end of Connecticut; as well as grades for more than 50 bays and waterways that feed into the Sound.
While the water quality of the Sound is much better than the 1970s and 1980s when the body was extremely polluted, the continual improvement trends that the nonprofit had noticed for the last decade have leveled off a bit. For example, the Eastern Narrows section of the Sound, which includes Greenwich, Stamford, and part of Darien, remains “in a variable state after seeing notable improvement from 2008 to 2017.”
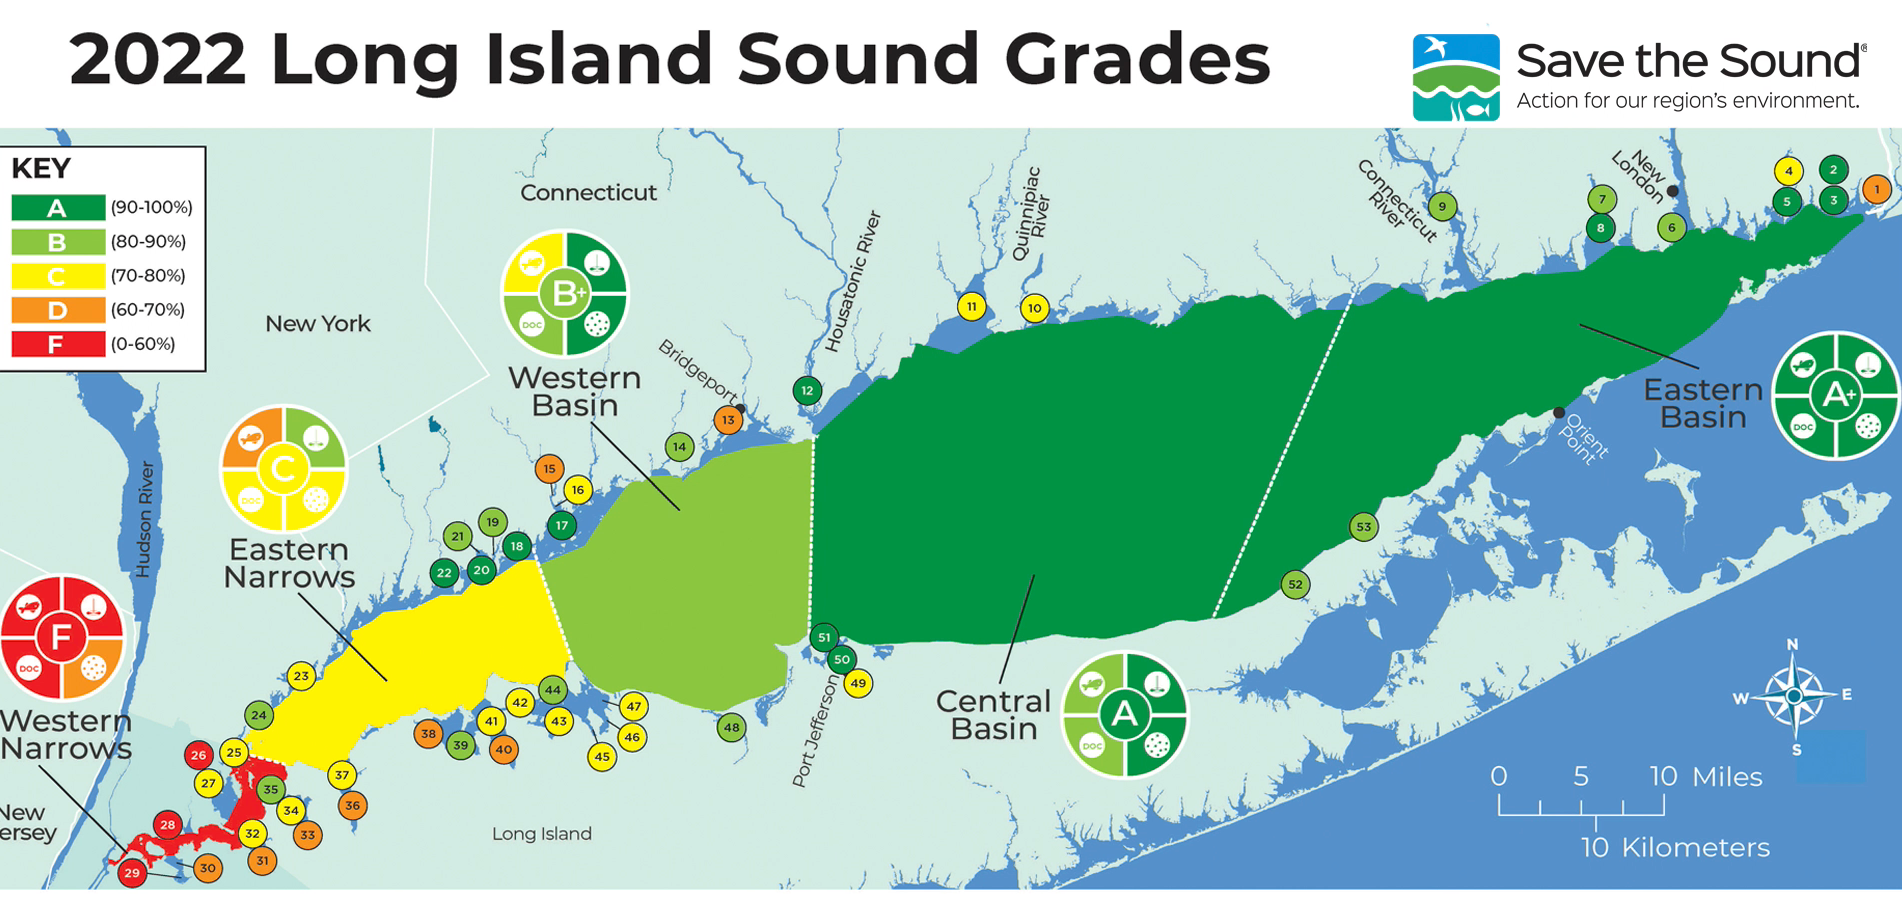
The 2022 report card breaks the main waters of the Sound into five main areas:
- Eastern Basin, which runs from just west of the Connecticut River to the eastern end of Connecticut, received an A+ grade for its water quality.
- Central Basin, which includes major cities like New Haven, runs from about the Housatonic River to just west of the Connecticut River. It received an A grade for its water quality.
- Western Basin, which includes major cities, like Norwalk, and Bridgeport, runs from just west of the Norwalk River to the Housatonic River. It received a B+ grade for its water quality.
- The Eastern Narrows, which includes major cities, like Stamford, runs from just north of New York City to just west of the Norwalk River. It received a C grade for its water quality.
- The Western Narrows, which includes the waters off and around New York City, received an F grade for its water quality.
The report also included grades for more than 50 bays along the coasts of Connecticut and New York that feed into the Sound.
“Only 24 out of 53 monitored bay segments, 45%, received a satisfactory grade of B- or better,” Jason Krumholz, Ph.D., a scientist with Save the Sound, said. “Only 11 earned an A- or better.”
“The critical message here is that while improvements have been made in Long Island Sound, there’s still more to do, with respect to nitrogen pollution reduction,” Colon said. “And the time is now to continue to bring actions to care for Long Island Sound.”
A breakdown of the 2022 Save the Sound report.
For the most part, the eastern end of the Sound and the bays that feed into it have better water quality than the western portions. Southwest Connecticut, which includes all the communities from Greenwich up to Fairfield had a mixed bag of results.
The Western Basin of the Sound, which primarily includes Norwalk, Westport, and Fairfield, has a higher water quality than the western portions of Darien, Stamford, and Greenwich. But the bays that feed into the Sound are rated higher in Greenwich and Stamford than the bays and waterways in Norwalk and Fairfield. The inner harbor of the Norwalk River received one of the top five worst grades for water quality.
“It's crucial that we continue to measure the water quality of the Sound on an ongoing and consistent basis and report on the results, so action can be taken to protect and restore,” she said.
Looking for how the grades impact our region? Check out our story on the Long Island Sound in Southwest Connecticut.
Why Are There Variations in the Grades?
For the most part, the eastern end of the Sound and the bays that feed into it have better water quality than the western portions.
That’s primarily due to the strong tidal exchange it has with the Atlantic Ocean, so the waters are flushed more constantly than the western region, and a much lower population density than the western region, according to Krumholz.
“The East to West gradient that we see is created primarily by our human footprint,” he said. “But it’s also influenced by the natural geography of Long Island Sound.”
Krumholz said that because “our population is concentrated in the western Sound, bringing wastewater discharges and stormwater runoff from hardened surfaces like roofs and roads into the coastal waters,” that impacts the water quality. But also, “in the western areas, poor flushing with the Atlantic Ocean exacerbates the water quality problems.”
Poor water quality in bays happens all up and down the Sound, not just concentrated in the western half, like the open waters. For example, Darien, Norwalk, and Stamford all had bays that scored A- or better, while the Wequetequock Cove out in Mystic, closest to the Atlantic Ocean, received a D-.
“These shallow bays are impacted by more local pollutant sources,” Krumholz said. “When coupled with poor flushing, the water quality in these bays can be worse than the open waters of the Sound.”
How are the Grades Calculated?
The areas are graded based on several water quality indicators that measure the health of the Sound through assessing the water’s ability to support aquatic life and marine habitats.
Those indicators for the open waters include:
- Dissolved organic carbon: measures how humans can impact the water
- Dissolved oxygen: needed to support marine life. Too little can reduce growth or at the lowest levels cause death of fish and plants in the water.
- Chlorophyll a: measures the amount of phytoplankton in the water.
- Water clarity: measures how far light can penetrate the water
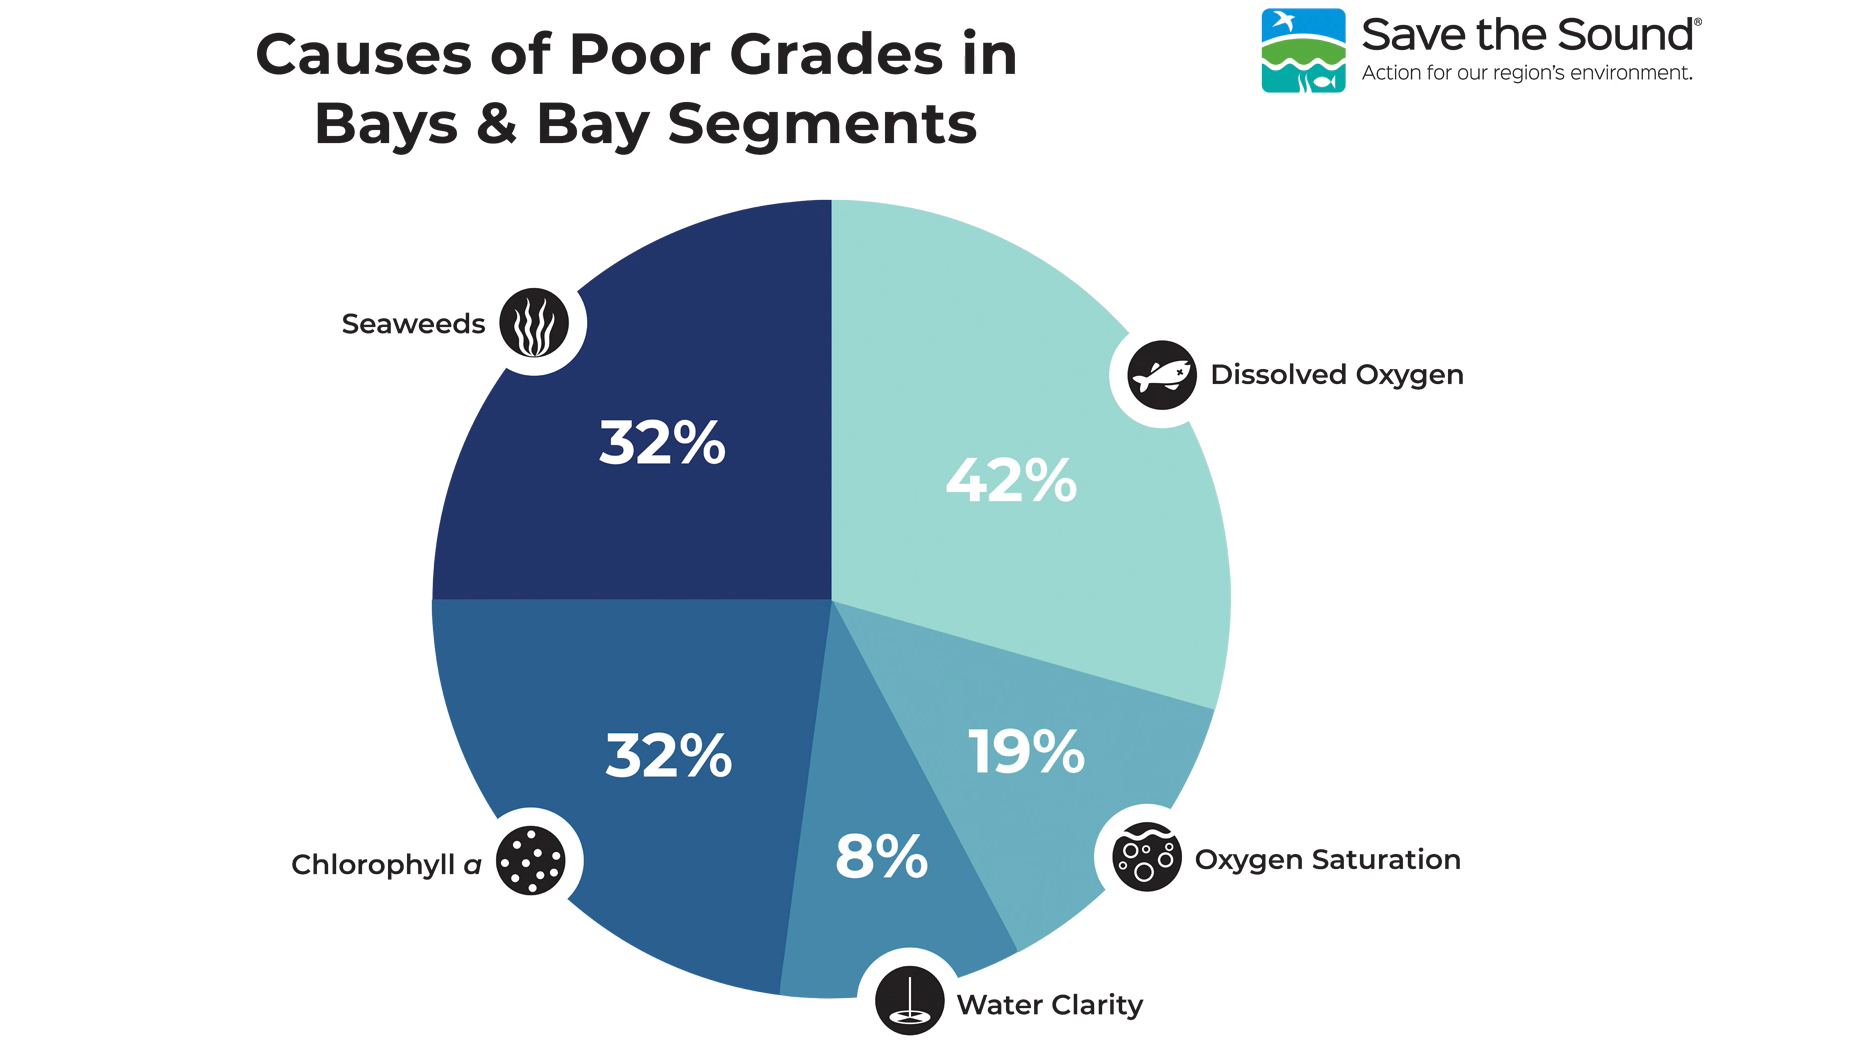
For the bays, the group measured dissolved oxygen, chlorophyll a, water clarity, and two other indicators:
- Seaweeds: measures how much seaweed is in the water—too much can be harmful and indicate excess nitrogen pollution in the water.
- Oxygen saturation: should be equal to the amount of oxygen in the air. When there’s too much or too little, it causes water quality issues.
How is the Report Card Used?
The report card is used by local, state, and federal policymakers to help them make decisions about usage of the Sound itself and the land around it, as well as to advocate for more funding and support for the Sound.
For example, Senators Richard Blumenthal and Chris Murphy cited the previous version of the report card to ask the federal government for “robust funding” for the Sound to address the water quality in it. Earlier this year, the Environmental Protection Agency’s Long Island Sound Study received $31 million to support projects such as upgrading sewage treatment infrastructure, restoring wetlands, protecting shellfish beds, and funding water quality monitoring projects.
Many of those projects take place at the local level and can have a direct impact on water quality in the Sound, Krumholz said.
“We know that if we continue to commit the necessary resources and efforts to the task at hand, we will continue to make progress toward healthy conditions throughout the Sound and its bays,” he said.
Krumholz said that this work and action to continue to improve the water quality of the Sound is even more important today.
“It’s a long road to ecological recovery,” he said. “While we’ve seen improvements in the last 14 years, there’s also alarm bells in the background. The impact of climate change threatens to undo some of the great work that’s been done. We must remain vigilant and take action.”
Check out our story that dives into what the water quality grades for our region are.