
Fairfield County Report Outlines Disparities, Challenges, and Opportunities in Southwest Connecticut
The Fairfield County Community Wellbeing Index 2023 from CT DataHaven outlines the wellbeing of the county—particularly some of the disparities across the region.
For residents across southwest Connecticut, health outcomes, school funding, transportation access, and more vary widely depending on location, race, income, and more, according to the Fairfield County Community Wellbeing Index 2023.
The report, which is put together by CT DataHaven, aims to help measure the quality of life in the county, which “has been marked by some of the sharpest disparities in the country in terms of the well-being of its population.”
Let’s dive into some of its findings related to overall community wellbeing, housing, economics, health, and education.
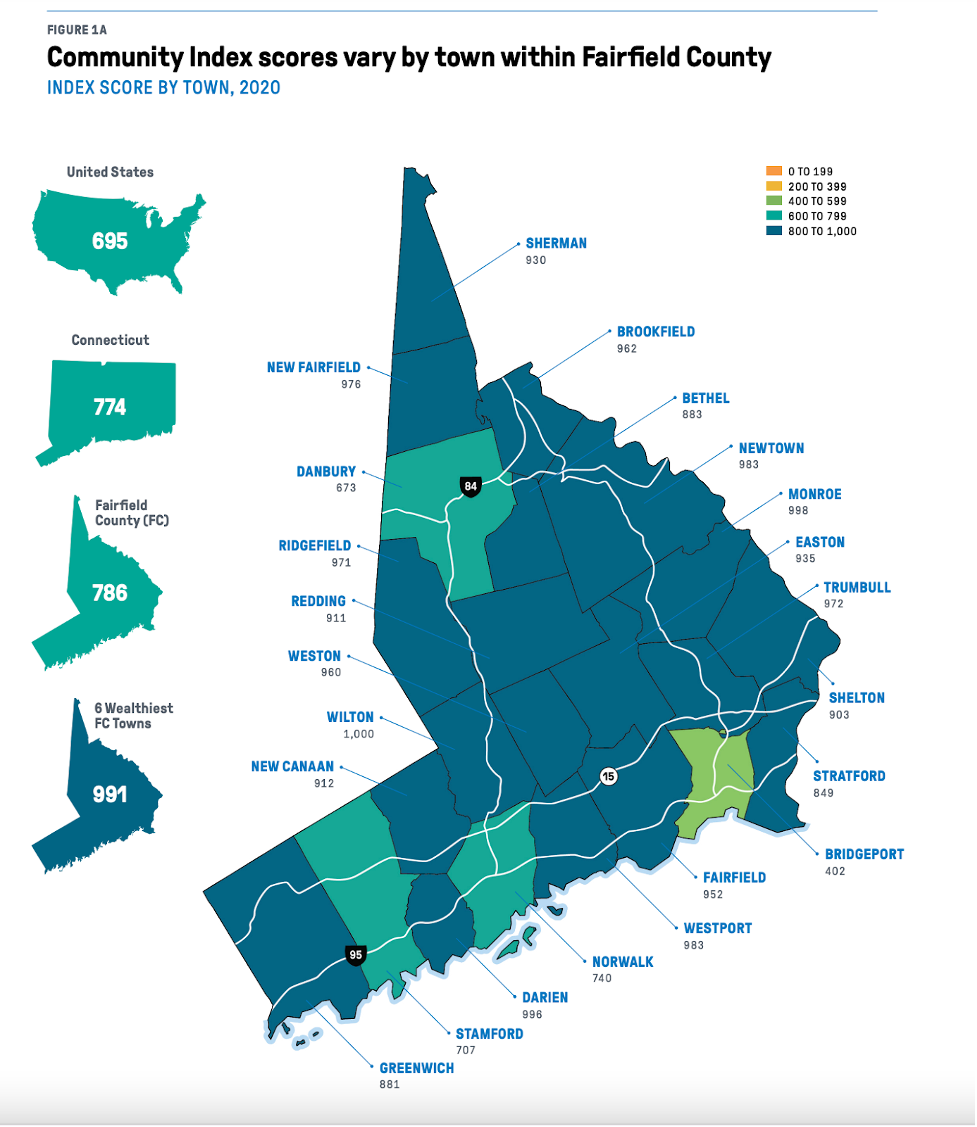
Overall Community Index
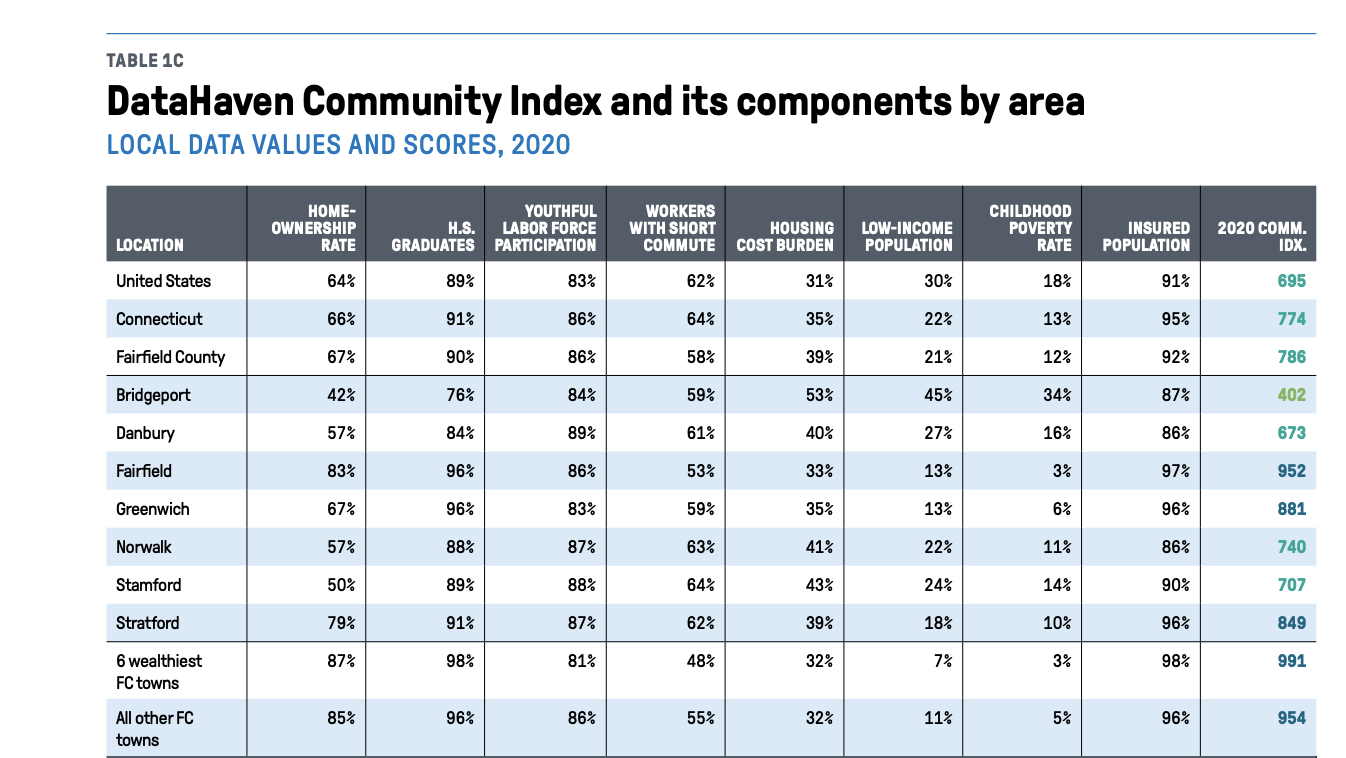
To get an overall picture of quality of life in the region, the report produces a community index that factors together several measures, related to economic, health, and education to produce a “community index,” which the report states, “allows readers to compare parts of Connecticut to one another.” The index combines these factors into an average score that ranges from 0 to 1,000. The United States as a whole has a community index of 695, compared to 774 for all of Connecticut, and 786 for all of Fairfield County.
In our region, the community index varies by municipality:
- Greenwich: 881
- Stamford: 707
- Darien: 996
- Norwalk: 740
- Westport: 983
- Fairfield: 952
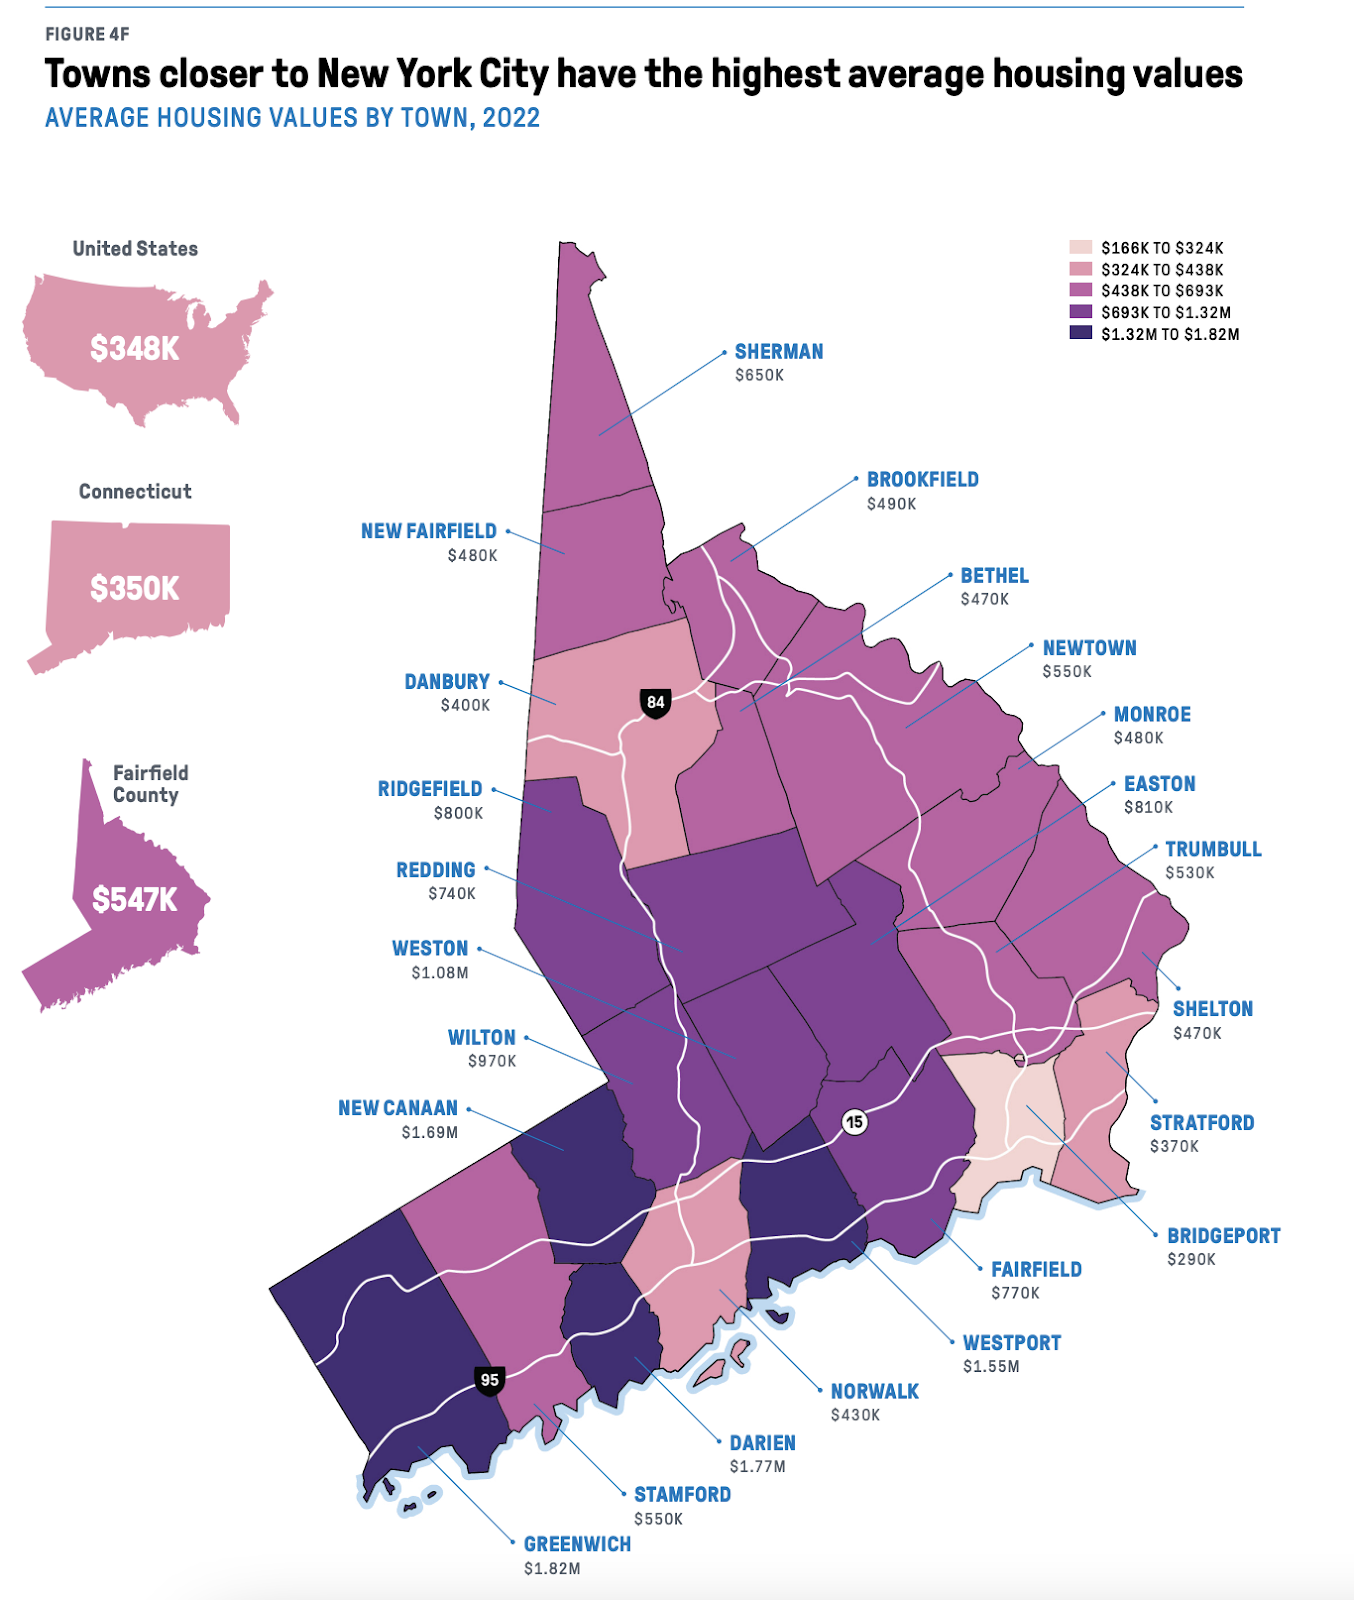
All of the community indexes in our region are higher than the overall index for the United States at 695, and all are above or close to the statewide index of 774. (See the featured image for the detailed map)
Stamford and Norwalk rank slightly lower than the others due to a variety of factors. For starters, the two cities have a higher share of their populations that are cost-burdened by housing, meaning they spend more than 30% of their income on housing costs, whether that’s rent or a mortgage. A higher percentage of lower-income residents and lower home ownership rates also contribute to Stamford and Norwalk’s slightly lower index score.
Population Growth and Housing
Fairfield County is growing faster than the rest of the state—a 4% increase in population vs. 1% statewide, but not evenly. The vast majority of the growth is occurring in the county’s urban areas, particularly Stamford, which, according to the report, “had a population growth rate of 11 percent, the fastest-growing city in the state.”
But all communities in the region have seen their populations increase, some just slightly, in the last decade, and this report did not capture some of the post COVID movements that saw some communities add even more residents. Between 2010 and 2020, here’s a look at how our region added residents:
- Greenwich: From 61,171 in 2010 to 63,518 in 2020
- Stamford: From 122,643 in 2010 to 135,470 in 2020
- Darien: From 20,732 in 2010 to 21,499 in 2020
- Norwalk: From 85,603 in 2010 to 91,184 in 2020
- Westport: From 26,391 in 2010 to 27,141 in 2020
- Fairfield: From 59,404 in 2010 to 61,512 in 2020
The area has also gotten more diverse over that time—and more diverse than the state as a whole, with Fairfield County having a higher population of Latino residents (21% of the population, compared to 17% statewide) and more residents who are foreign-born (22% vs.15%). The younger populations are the most diverse, as 47% of 18 and younger residents in Fairfield County are nonwhite.
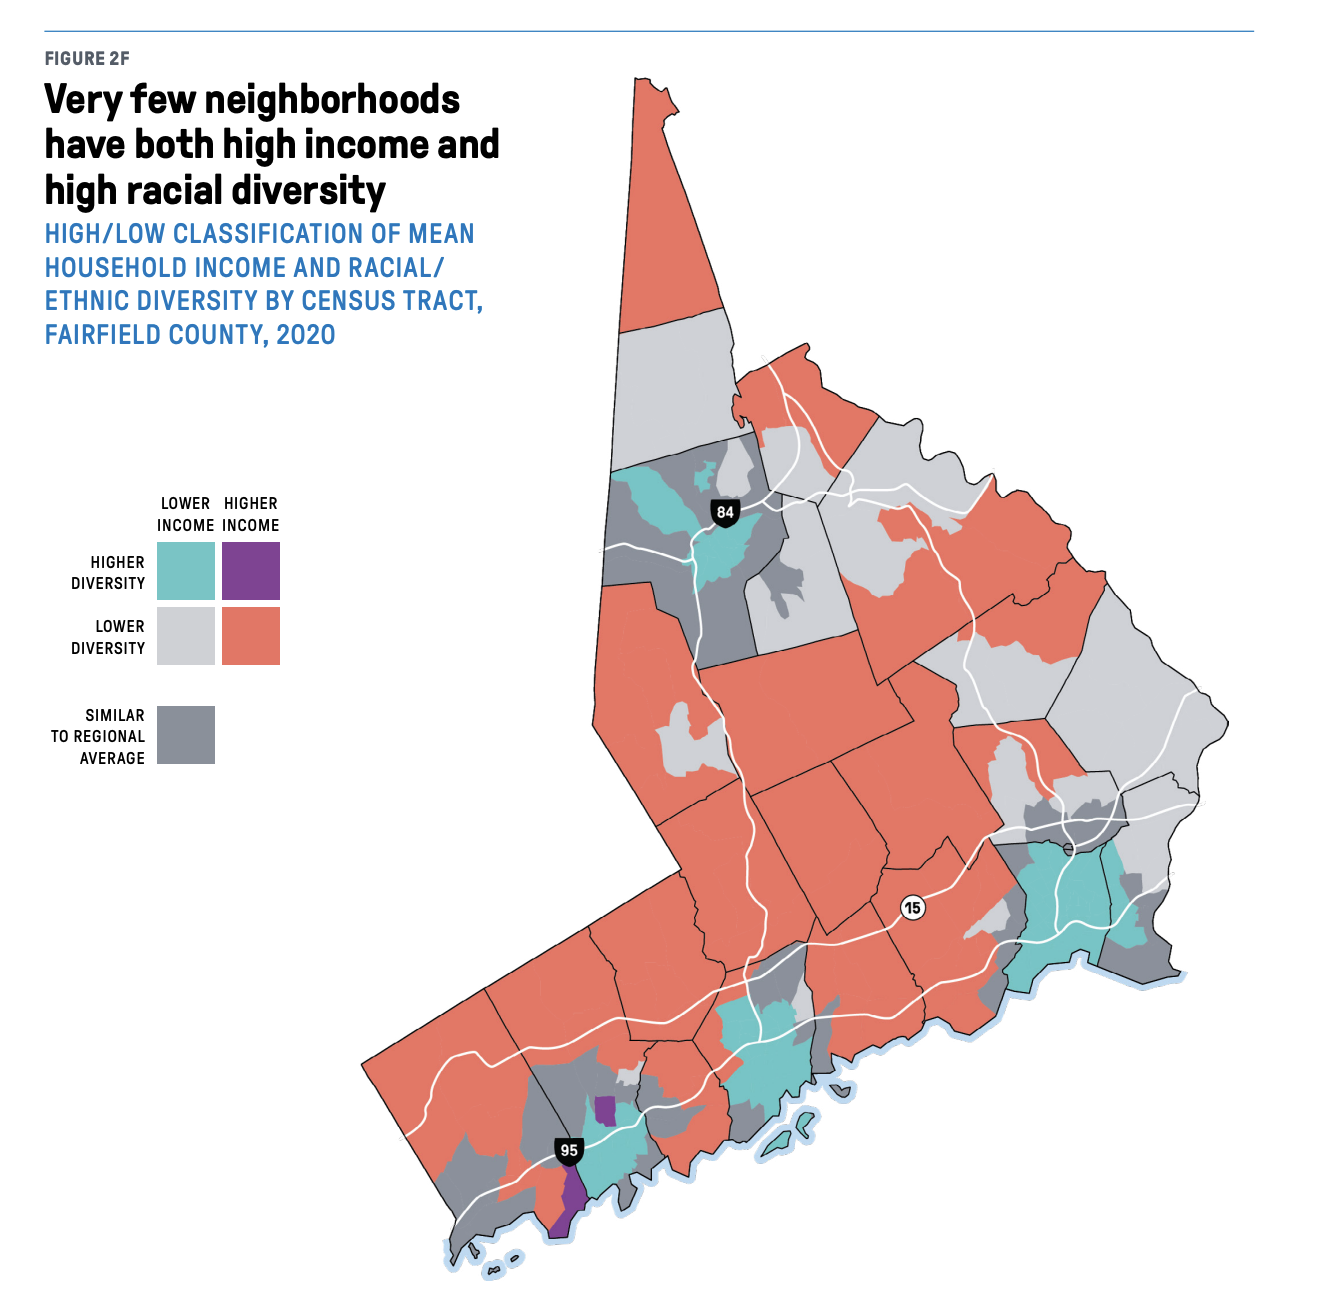
But one of the findings of the report is that diversity varies by community. The report found very few communities with both a high racial diversity and a high level of income, with just a few neighborhoods in Stamford and Greenwich meeting this criteria.
“Much of Fairfield County consists of large clusters of very high incomes and very low racial diversity,” the report found. “Only 1 percent of the county’s population lives in a neighborhood that is both high income and high diversity. Thirty-six percent live in neighborhoods that are low income and high diversity, many of which are concentrated in the region’s larger cities, while 27 percent live in high income, low diversity areas.”
Along with the growth in population, the report found that one of the biggest needs in the region is affordable housing, as many residents are cost-burdened by housing—meaning they spend more than 30% of their income on it.
“Fifty-two percent of renters in Fairfield County are cost-burdened, meaning they put more than 30 percent of their monthly income toward housing costs,” the report states. “While half of Black and Latino households in Fairfield County are cost-burdened, only a third of white households in the region are.”
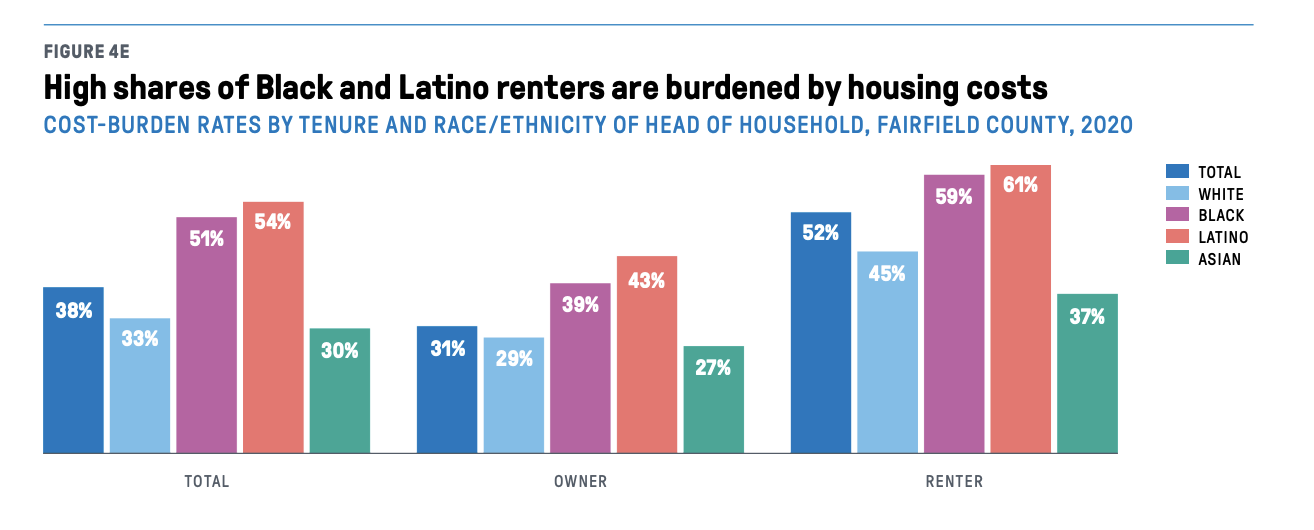
The region has also seen a dip in home ownership, which fell from 71 percent in 2010 to 67 in 2020. There’s also a significant gap in homeownership both by income levels and race—”the homeownership rate among white households (77 percent) was almost double that of Black (42 percent) and Latino (40 percent) households.”
Also renters are more cost-burdened than homeowners—52% of renters compared to 31% of homeowners.
A major reason for this, according to the report, is the rising cost of housing—both home prices and rentals.
“Between 2020 and 2022, home prices increased by 32 percent in both Connecticut and Fairfield County, and 34 percent in the country overall,” according to the report. “The cost to rent a typical apartment or house in Fairfield County increased 22 percent from June 2020 to June 2022.”
This has led to a rise in homelessness, overcrowding, and evictions across the region over the past few years.
Despite the population growth, the report found that there’s been a decrease in the number of construction permits: “Between 2006 and 2009, the average rate of construction permits issued each year in Fairfield County was 56 per 10,000 households. Between 2018 and 2021, that rate dropped to 48.”
But multifamily housing construction has increased, mainly due to growth in Stamford, where the report found that “the number of permits grew from 60 to 70 per 10,000 households between 2006-09 and 2018-21.”
Economically Unequal
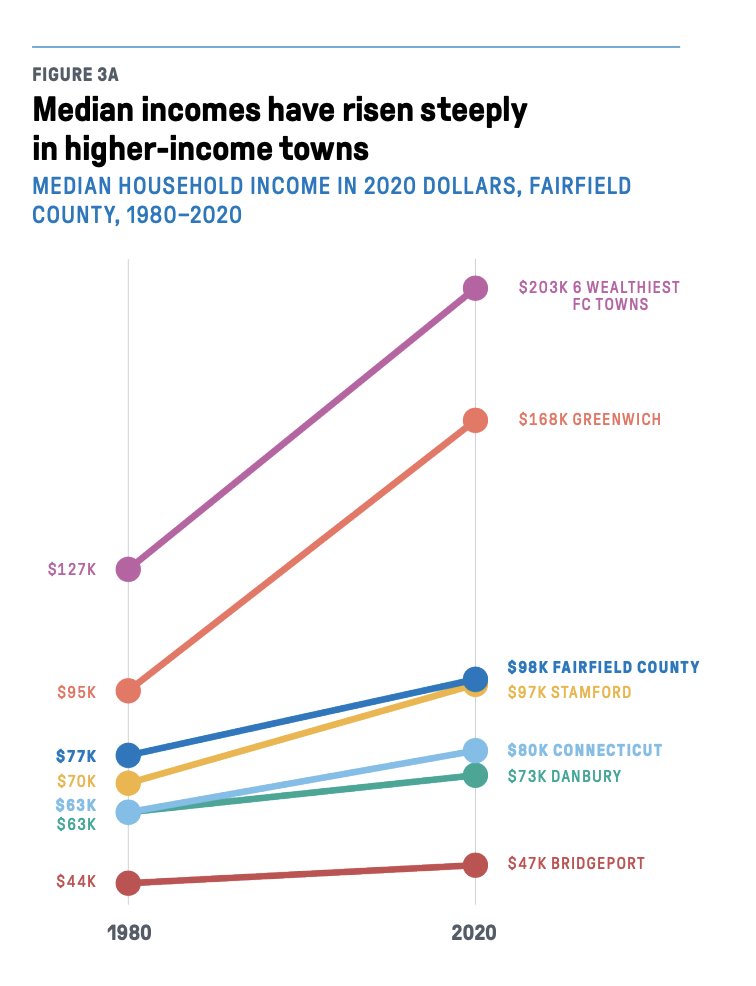
“Fairfield County now has the second-highest income inequality among all metropolitan areas in the country,” according to the report.
Overall, the county’s median household income sits at $98,000, which is higher than the state and country, but the growth has been driven by the county's wealthiest communities—the median incomes in the wealthiest went up more than 60% since 1980, while Bridgeport saw its median income only increase by 9%.
Education Discrepancies
But despite the population growth, the enrollment picture at the schools is a different story. Many districts are reporting an uptick over the past year or two after new families have moved in following the COVID-19 pandemic, but over the past 10 years, the county lost about 7,000 students.
Fairfield County districts enrolled a total of 137,701 students during the 2021–22 school year, about 7,000 fewer than in 2011–12.
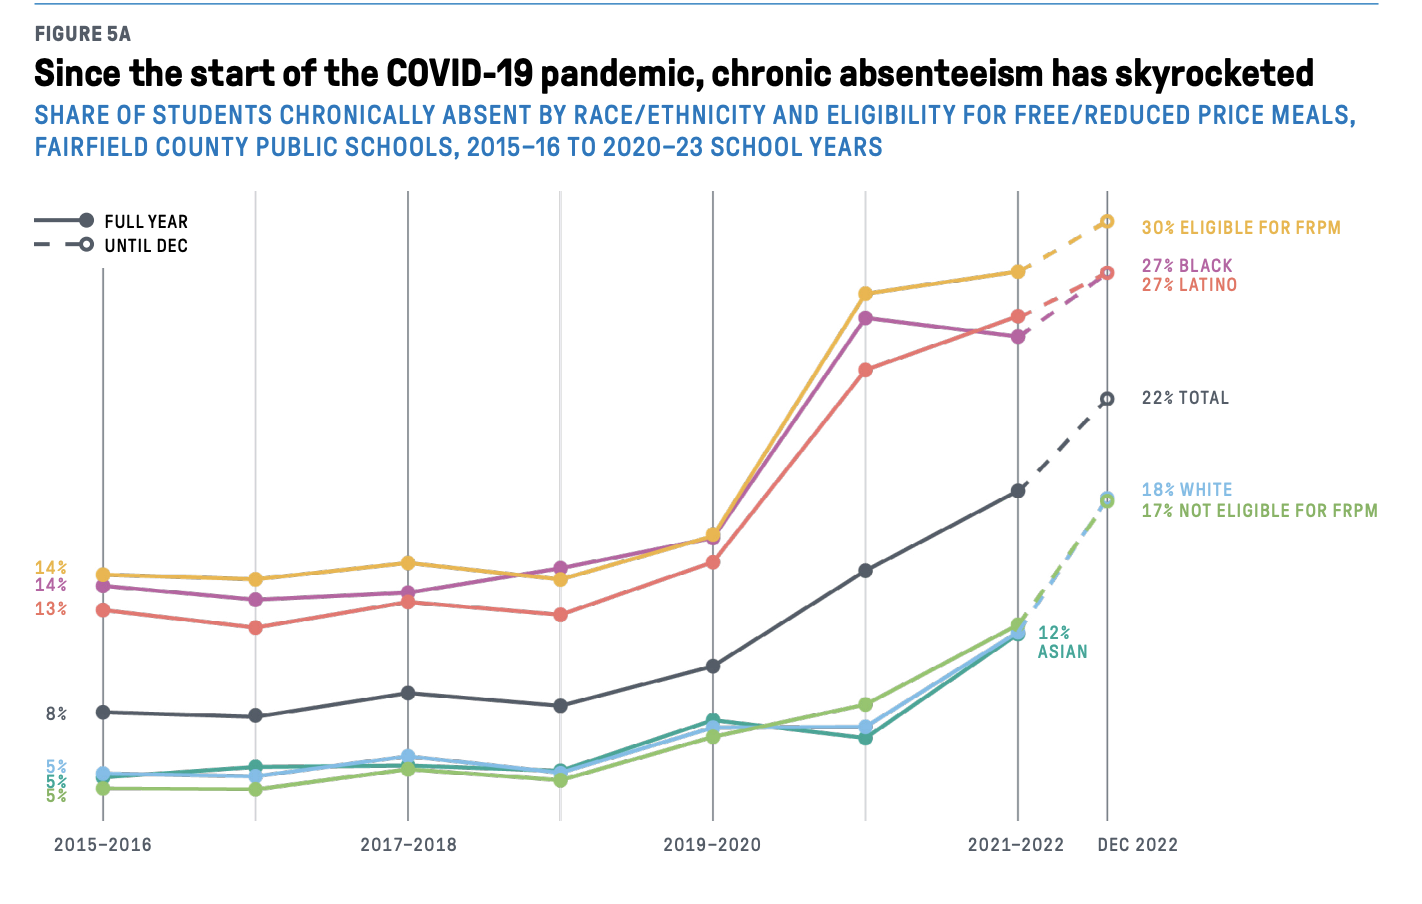
The pandemic has also posed challenges. Chronic absenteeism—or students being absent for 10 or more days—spiked and with online learning, many students left the public school system. “Fairfield County districts had about 2,000 fewer students than would be expected from the downward trend alone in the most recent school year,” according to the report.
Achievement in schools is also very varied by race, school district, and if the student is in special education or a multilingual learner.
For example, 85% of Westport students scored a passing rate on their English Language Arts Grade 3 test, compared to 71% of Fairfield and Greenwich students, 38% of Stamford students, and 34% of Norwalk students. Across all of Fairfield County, 70% of white students scored a passing grade on that test, compared to 48% of Asian students, 24% of Black students, 28% of Latino students, and 48% of Asian students.
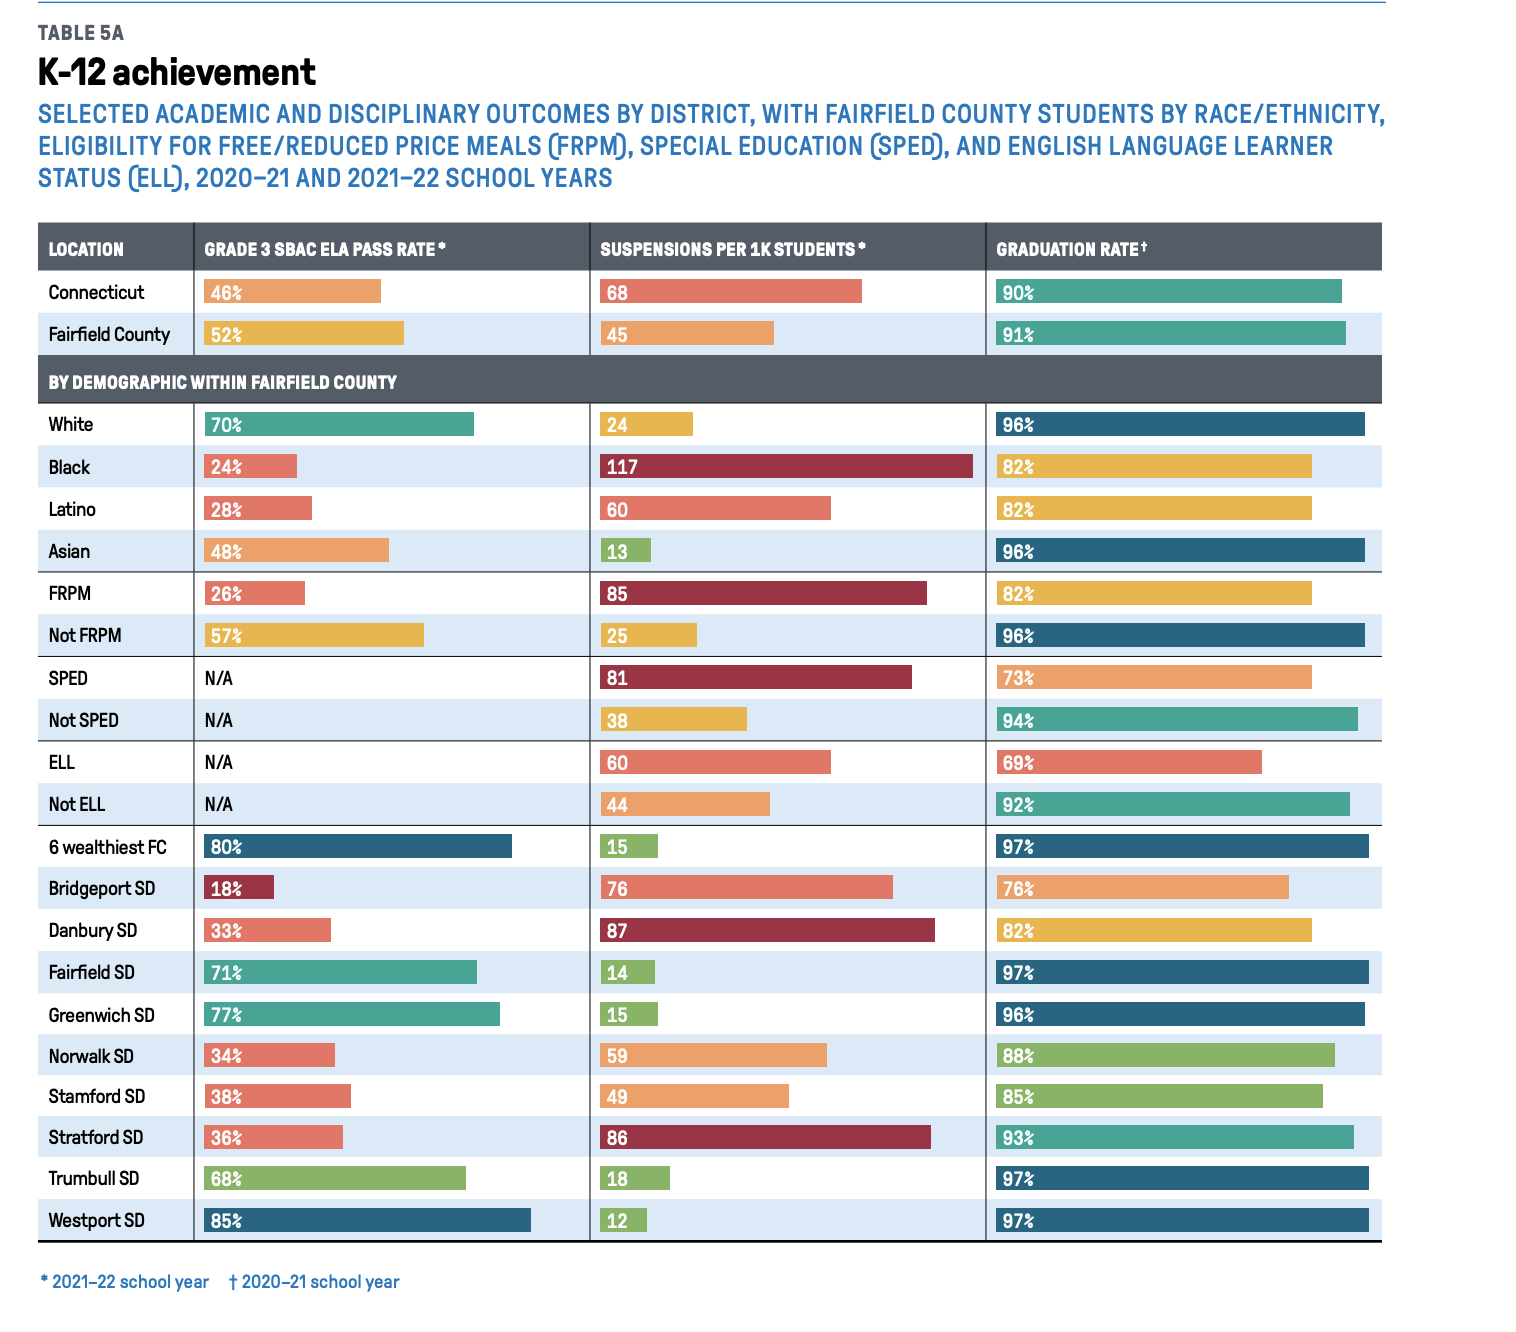
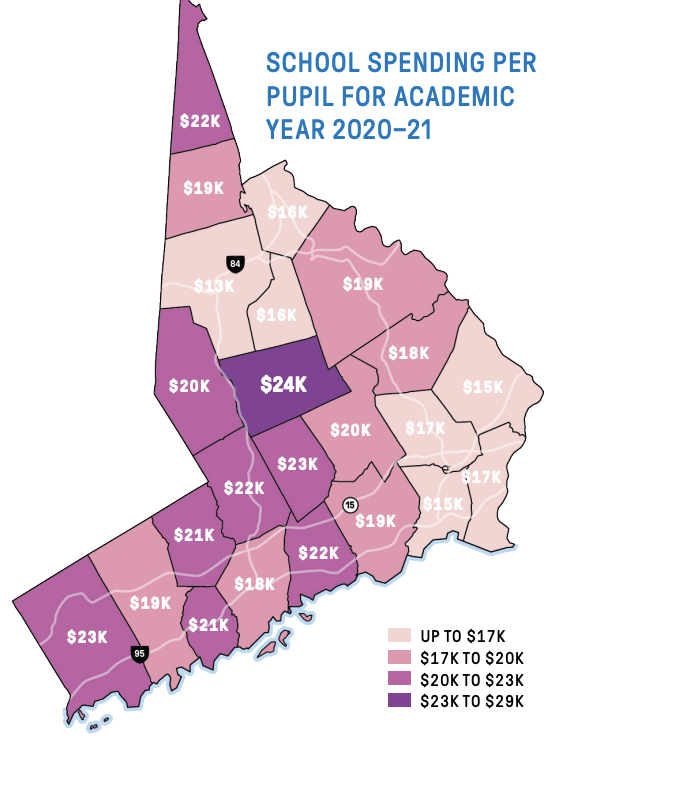
The report also found gaps in educational spending, which particularly highlights the disparities between wealthy and non-wealthy communities. For example, the report found that “Stamford spends an average of $19,000 per student per year, and 76 percent of adults believe the city is a good place to raise kids. Bridgeport spends $15,000 per pupil per year and only 34 percent believe the same.”
Norwalk, Stamford, and Fairfield all spend $18,000-$19,000 per pupil, while Darien, Greenwich, and Westport, each spend more than $21,000 per student.
Health Discrepancies
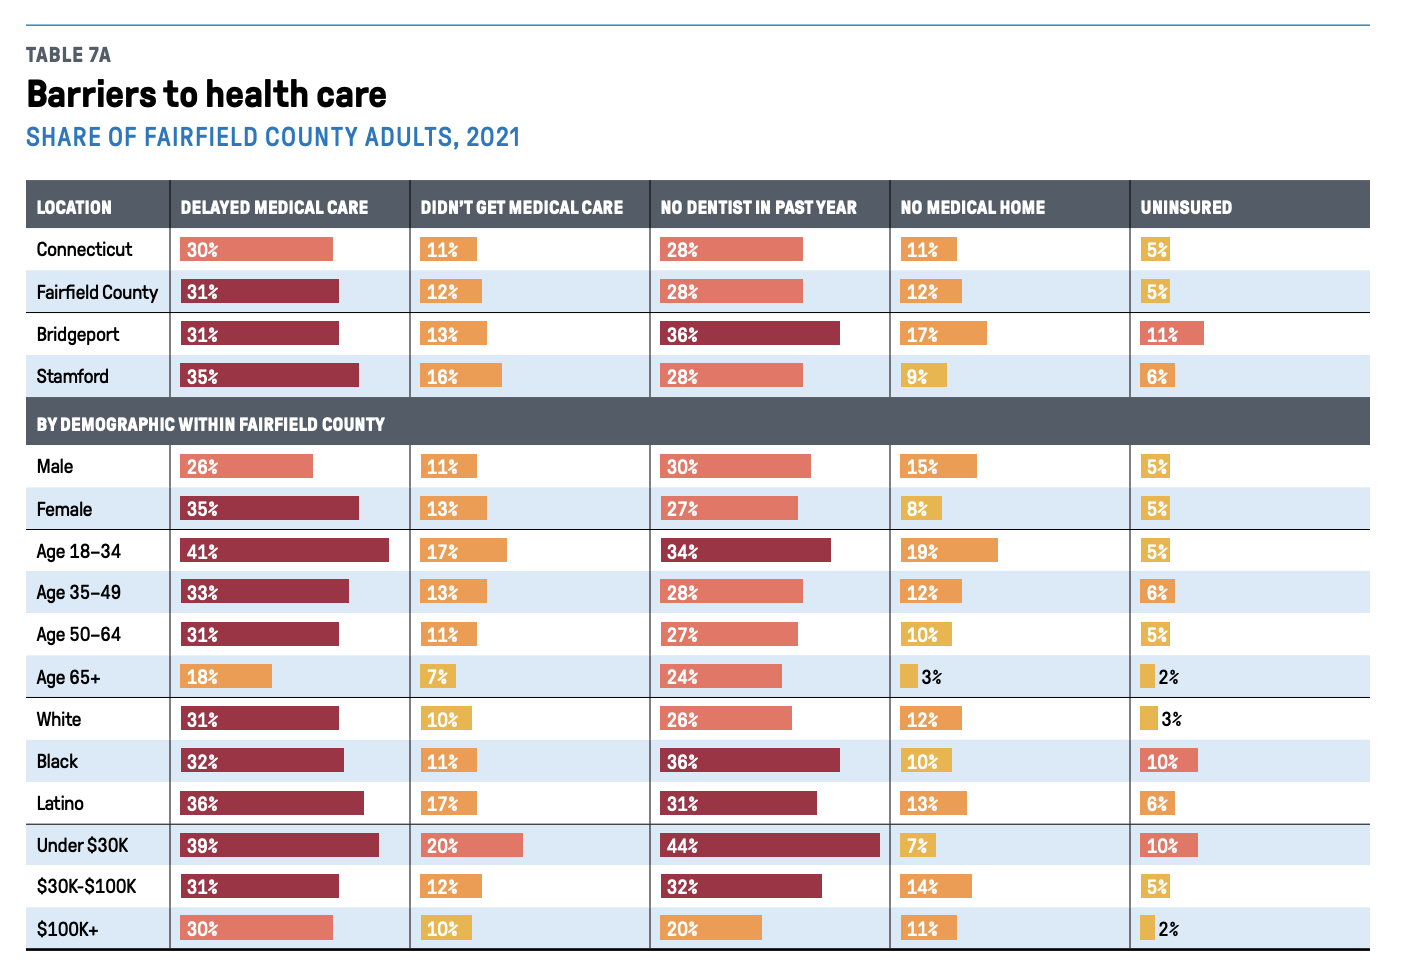
The report found wide gaps in insurance coverage, as “Black adults and low-income adults in Fairfield County are twice as likely to lack health insurance compared to the county and state overall.”
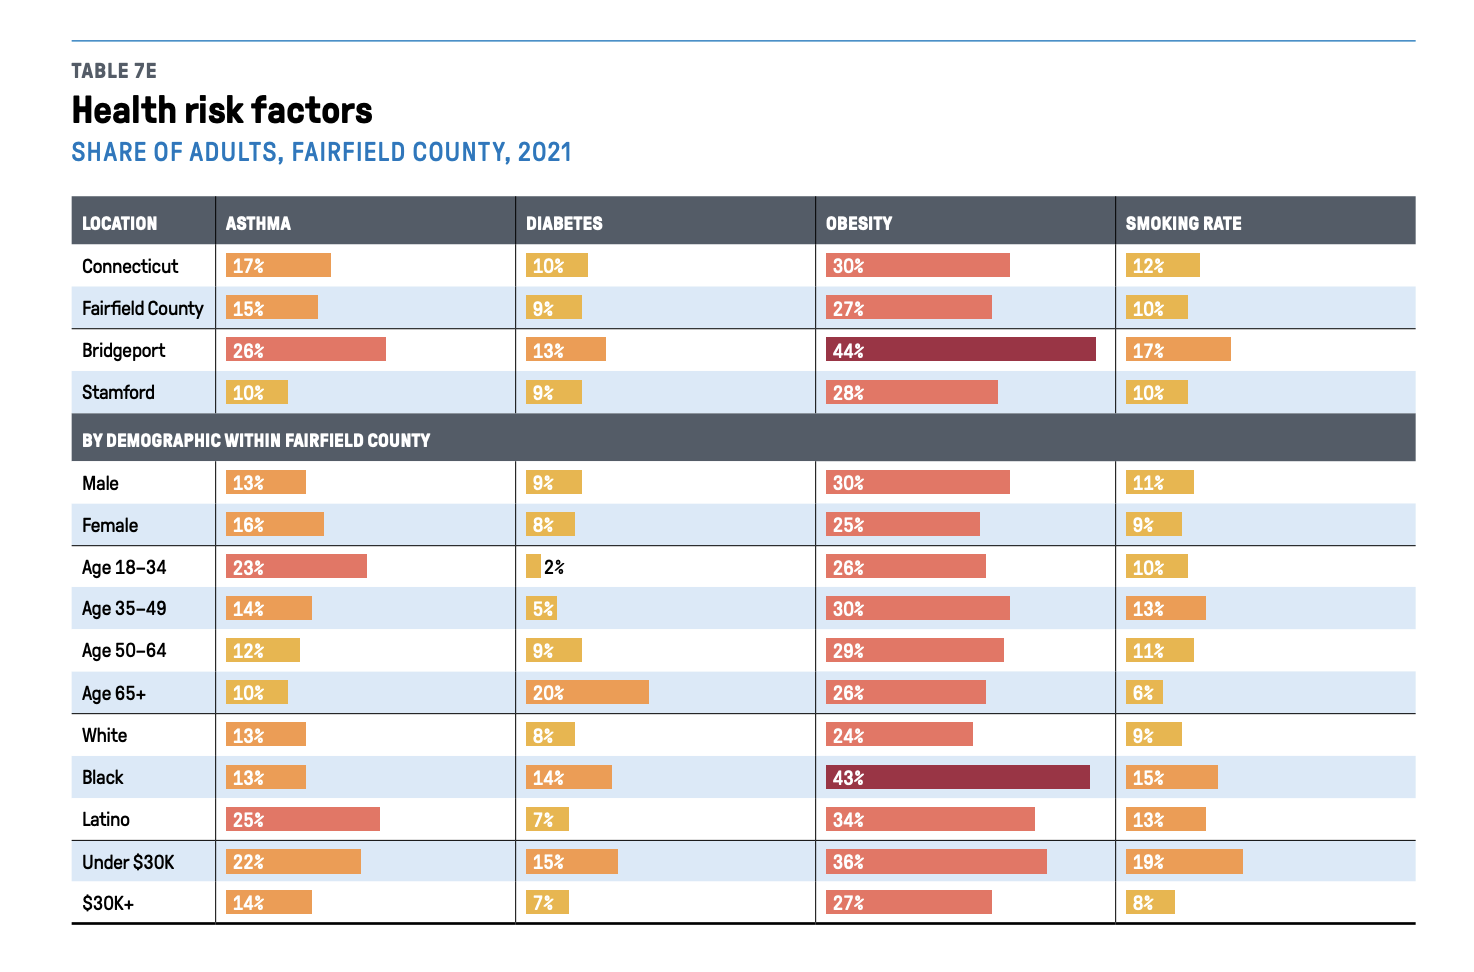
Also, environmental health impacts varied widely across the region, as the report found that “adult asthma, often linked to environmental conditions such as poor housing or air quality affects one in four Bridgeport residents compared to one in ten Stamford residents.” Environmental factors also vary by race, with about 25% of Latino residents affected by asthma compared to 13% of white and Black residents. Black residents also have a much higher rate of obesity in Fairfield County, with 43% compared to 24% for white residents and 34% for Latino residents.
These health disparities exist in children as well. For example, “between 2018 and 2021, 3 percent of children in Bridgeport tested positive for elevated blood lead levels, compared to about 1 percent in Stamford and just one quarter of 1 percent in Greenwich.”
Infant mortality also varies widely around the region, primarily by race. The infant mortality for Black babies in Fairfield County is at 9.2 deaths per 1,000 live births compared to just 2.7 for white babies. The rates also vary by town, with Bridgeport having higher overall infant mortality rates for all races.
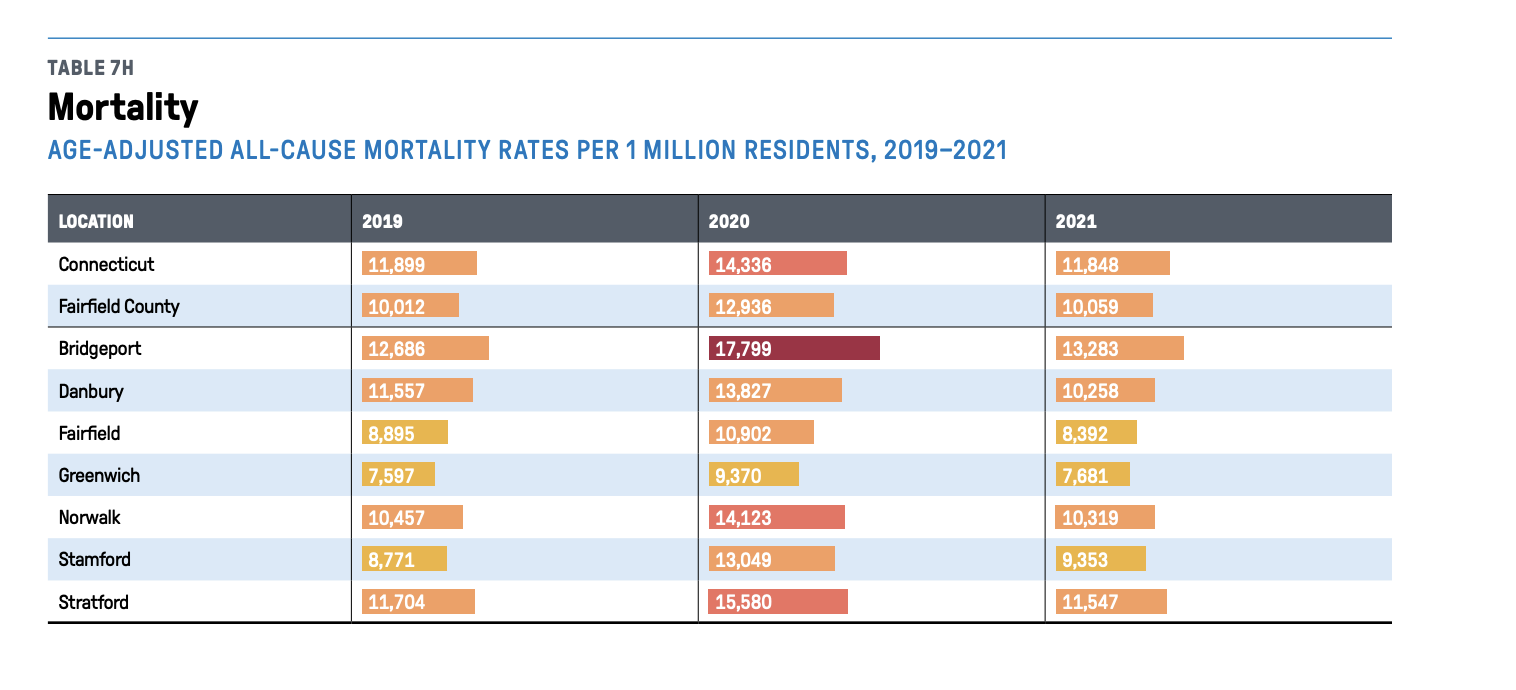
While cancer and heart disease are the main causes for death and “life years lost” around the region, some municipalities saw issues such as gun violence and drug overdoses rise on the list. The report found that “firearm deaths in particular cause more than four times the rate of life-years lost in Bridgeport compared to Fairfield County overall.”
Putting all the different types of death together, the report found that “the rate of life-years lost in Bridgeport is more than three times higher than in Greenwich and nearly twice as high as in Stamford.”
What to Do with This Information
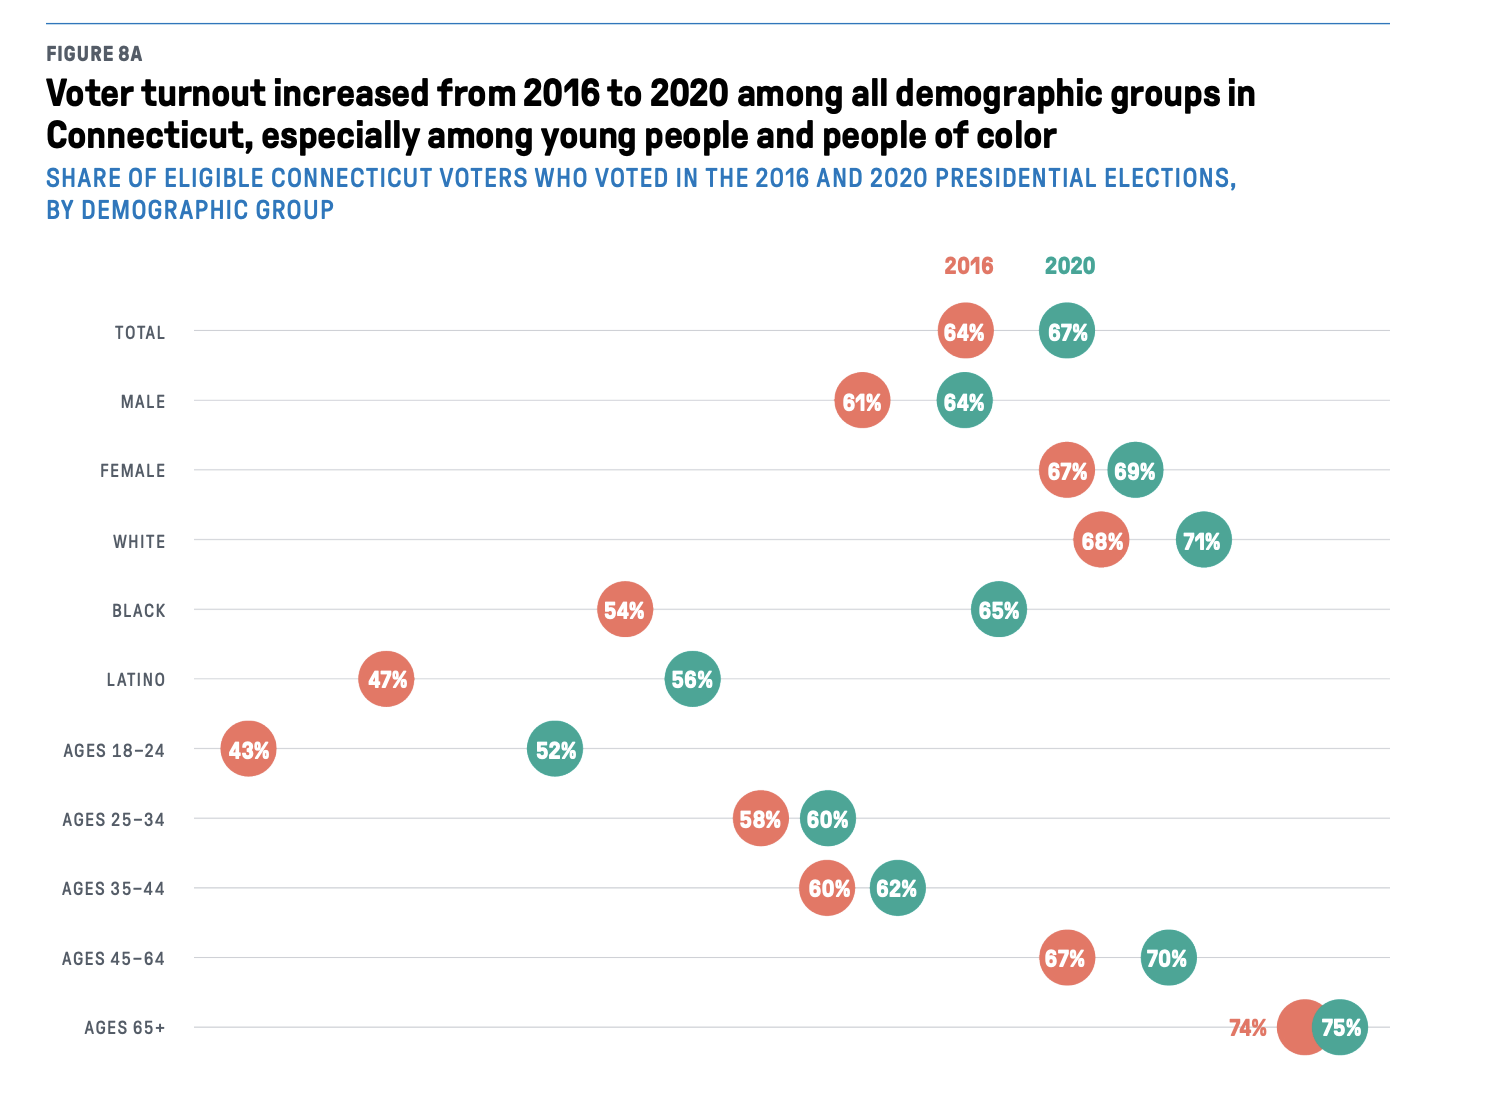
One of the positive outcomes found in the report is that voter turnout has increased across the region, particularly among younger voters.
One of the ways to put this report into action is to use the data and information to support policies and leaders that address issues that matter to you, such as infant mortality or educational achievement. You can also use this information during budget hearings or other public comment sessions to ask elected officials to put resources into addressing some of the challenges outlined, such as those around housing or environmental health concerns.
The writers of the report encourage policy officials to use the report “to look beyond current trends and consider how present conditions may influence future generations’ well-being.”
“This report examines present residents’ well-being, but many of the underlying forces shaping that have been in play for generations,” the report states.
Check out the full report for Fairfield County.